


EnviroMail 47 Canada - Data Trending and Annual or Periodic Reporting Simplified with ALS Solutions
New charting tools within ALS Solutions allow quick and easy graphical trending of selected parameter test results.
This is the second in a series of EnviroMails on new capabilities of ALS Solutions, highlighting powerful new tools to view and chart data trends over time and to prepare annual reports from test results at any given site or sampling location. EnviroMail 46 introduced improved compliance reporting tools and automated guideline exceedance alerts.
Graphical Data Trending Features
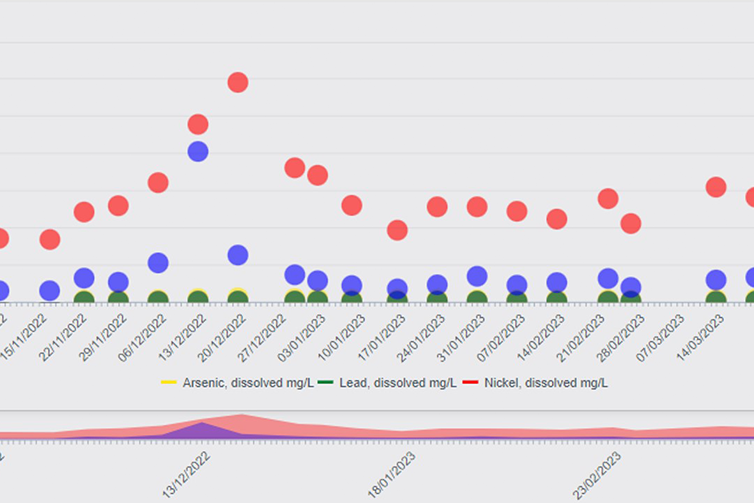
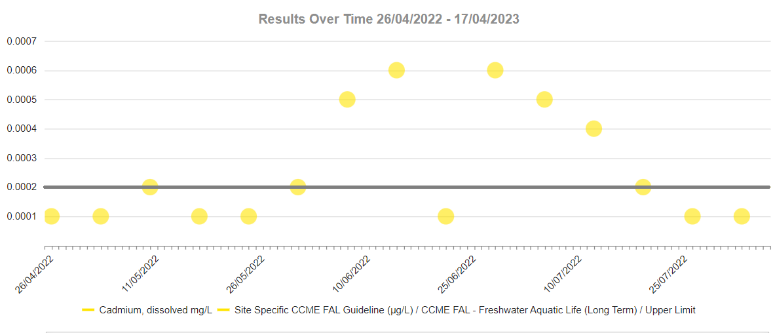
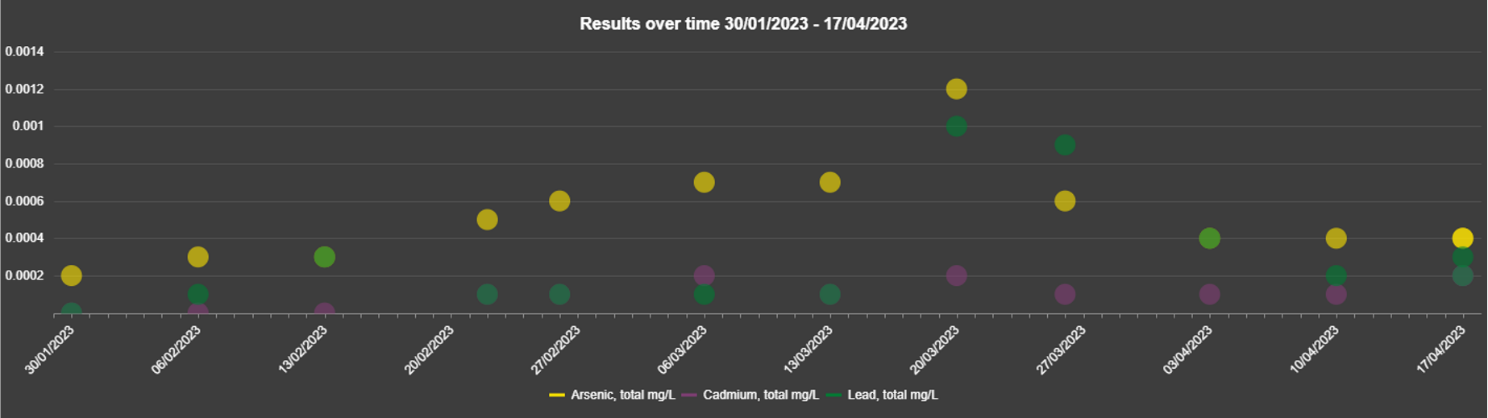
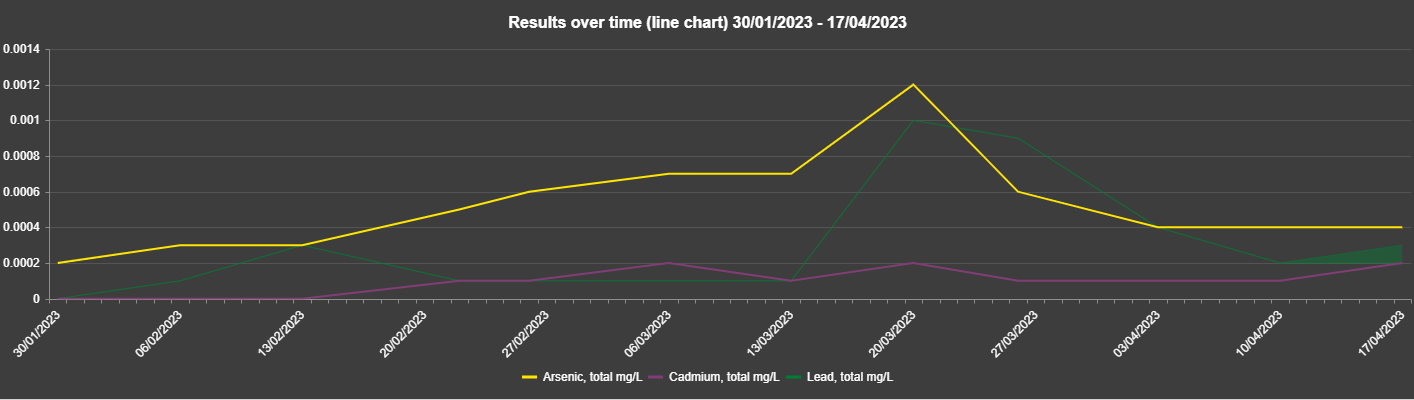
New charting tools within ALS Solutions allow quick and easy graphical trending of selected parameter test results. For example, Figure 1 shows Cadmium data trends over time, plotted against a site-specific CCME Freshwater Aquatic Life guideline. These plots are easily created in ALS Solutions for single or multiple parameters, with or without associated guidelines, across user-selectable timeframes, to quickly identify and visualize temporal data trends and inter-parameter correlations.
Handling Variable Guideline Limits
Several Canadian guidelines are variable, with the final measure dependent on the results of other tests or sample properties (e.g. Cadmium guidelines may be dependent on Hardness). For variable guidelines, the default values configured in ALS guideline reports represent the most stringent limits. ALS Solutions allows users to calculate and input site-specific guidelines as a function of other test results, which can then be applied within data charts or tabular reports.
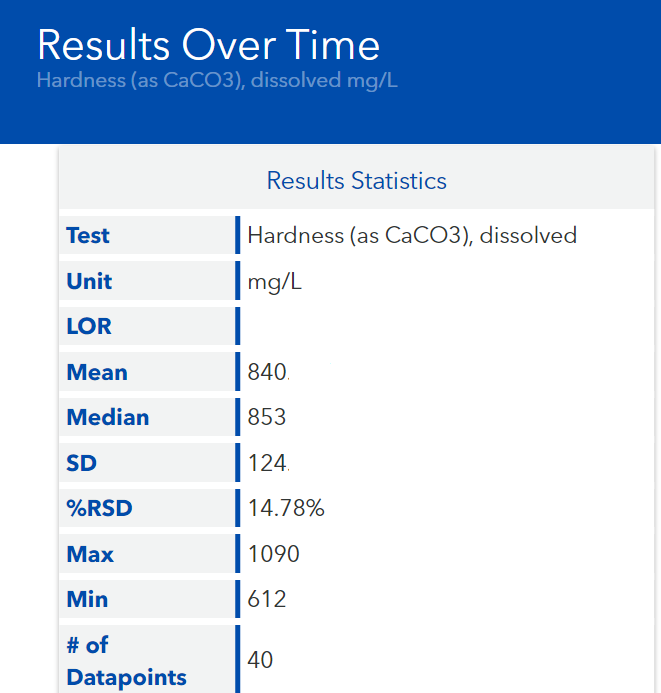
Analyte Statistics over Time
Another valuable feature within ALS Solutions is the ability to generate and display statistical outputs for any test parameter over a specified time range. For example, the statistical outputs for Hardness in Figure 2 were used to calculate a location-specific Aquatic Life limit for Cadmium, which was then applied to generate the trend plot for Cadmium in Figure 1. Calculated location-specific limits can also be used to create exceedance notifications or location-specific compliance reports, as discussed in EnviroMail 46.
Annual/Periodic Report Formats
ALS Solutions also provides a simple way to create charts and tables for use in annual or periodic reports. Please follow the ALS Solutions User Guide to create a Generic Annual Data Trending Report from the Excel Report Creation icon in the Project Management Links widget. This report has been created with a wide variety of Excel templates to allow intuitive viewing and presentation of key test result information. The report can be customized by date, sample location, project, and analyte list, allowing customized creation of reports for any parameters of concern (e.g. analytes under permit) for any sample location over time. Dates may be filtered for monthly, quarterly, semi-annually, or yearly reporting.
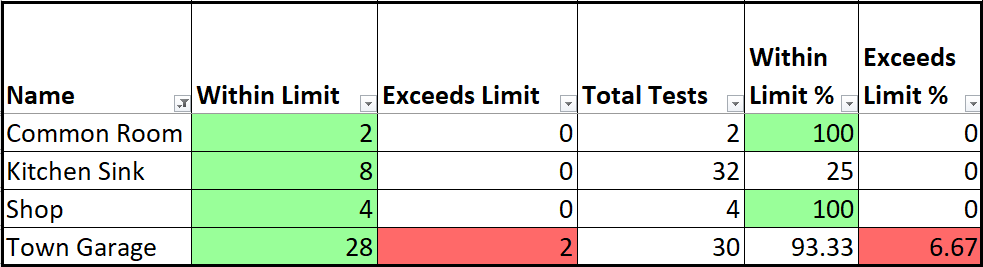
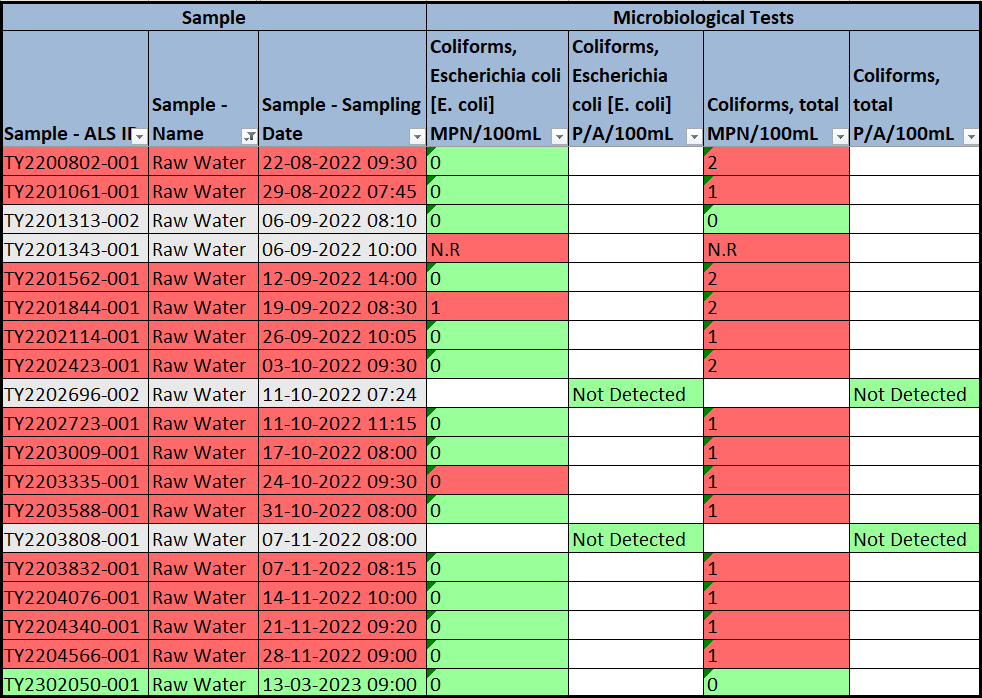
Figures 3 and 4 illustrate two tables from the generic report. Figure 3 summarizes the number and frequency of test results that pass or fail guideline limits for selected sample locations. Figure 4 shows a table that can be filtered to show any analytes responsible for failed guideline limits for any given sample location (e.g. Total Coliforms and E. coli for the example sample “Raw Water”).
Figures 5 and 6 show two example chart formats generated by this report. Results can be displayed with standard or logarithmic scaling. There is also a configurable option to present results that are below the Limit of Reporting (<LOR) as zero, ½ LOR, or LOR on charts and Excel reports.
ALS Solutions has pre-configured options for eleven other Excel templates which can all be generated automatically in the Generic Annual Data Trending Report. Additional templates can be configured within ALS Solutions if required for specific applications, and any of Excel’s charting functions can also be incorporated.
For more details, the ALS Solutions User Guide can be downloaded from the Technical Support widget on the home window of the application. Most of the features discussed above are accessed through the View Results Over Time and Guideline Creation sections of the application.
For initial account setup or to schedule an ALS Solutions demonstration, please contact your ALS Canada Project Manager. To setup and authorize new users and permissions, please contact your company’s ALS Solutions administrator