


EnviroMail 54 Canada - Quality Assurance Assessment Tools to Assist Project Data Quality Review & Reporting
ALS provides a comprehensive Quality Control Interpretive (QCI) report by confirming whether or not all the crucial Quality Control and Quality Assurance elements of testing were met.

Important decisions based on laboratory test results can only occur when stakeholders have confidence and context in the quality of the entire testing process, including holding time conformance
The ALS interpretive report is 100% automated (report untouched by human hand) and provides an instant assessment of quality data to save industry experts time and rapidly advise of any non-conformances which could impact project decisions.
Common Quality Control Sample Types
Quality Control (QC) is a crucial component in providing reliable and defensible data. Quality Control is implemented in our laboratories by utilizing appropriate industry-standard QC sample types, which demonstrate control of laboratory processes and confirm that tests are performing as expected. QC samples are introduced at critical points of sample handling, preparation, and analysis.
Instrument QC (e.g. calibration checks) demonstrates control of the instrumental portion of a method. Instrument QC requirements must be successfully met before the analysis of Method QC or client samples may proceed.
Method QC encompasses the entire test method, including all sample preparation and instrumental analysis factors. Appropriate Method QC depends on the type of test, but often includes Method Blanks, Duplicates, Laboratory Control Samples, Matrix Spikes, Surrogates, and Reference Materials. The results and evaluation of Method QC samples are important to verify the quality of sample test results.
Table 1. Common Quality Control Types
| QC Type | Definition and Purpose |
| Method Blank | A blank matrix that has gone through the same analysis steps as samples, used to monitor variability of the blank response, contamination, and bias. |
| Duplicate | A second aliquot of sample analyzed independently from the primary test sample. Assesses variance (precision) of the total method including lab sub-sampling and analysis. |
| Laboratory Control Samples | A clean matrix that has been fortified with a known amount of target analyte, used to verify the accuracy of the test method. |
| Matrix Spike | An aliquot of client sample fortified with a known amount of target analyte, used to identify matrix interference effects on method recovery. |
| Surrogate | An organic compound with similar chemical composition and properties to the target analyte(s), used to monitor analyte recovery / extraction efficiency in each sample. Commonly used in organics testing. |
| Reference Material | A material or substance with homogenous and well-established properties, used to assess the performance of a measurement method. |
Data Quality Objectives
ALS Data Quality Objectives (DQOs) are the performance specifications that define QC control limits. DQOs are established for each QC type, based on a combination of reference method objectives, customer requirements, and historical test method performance.
Holding Times and Causes of Analyte Change
Another key element of data quality for the evaluation of laboratory test results is consideration of holding times. Holding times are the maximum recommended elapsed time between sample collection and commencement of preparation or analysis, as appropriate. Holding times are based upon published reference methods, industry standards, and provincial requirements. Meeting holding times is important to ensure that measured analyte concentrations accurately reflect the condition of the sample at time of collection. Please refer to the Sample Collection Pocket Guide for holding times applicable to most common ALS tests.
There are many reasons why parameter concentrations within environmental samples can change over time after sampling, even where appropriate preservation techniques can be applied. Some common reasons follow, including whether a negative or positive bias may occur:
- Bacterial degradation (e.g. ammonia→nitrite→nitrate; negative or positive bias)
- Oxidation or photodegradation (negative or positive bias)
- Metals precipitation or adsorption to bottles (negative bias)
- Microbial morbidity or continued growth (false negative or positive)
While exceeding holding times does not necessarily mean results are no longer valid, additional context and information about how exceedances may affect the samples is needed.
How ALS Assists in Project Data Quality Review
ALS provides important information to clients in the form of several reports designed to confirm whether project Data Quality Objectives have been achieved. Given the risk of negative and positive bias, it is crucial that samples are received with appropriate sample containers, preservation, temperature, and within applicable holding times. ALS provides an initial assessment of these factors at the time of sample receipt, which is reported to our clients through our Sample Receipt Notification (SRN) report as soon as sample reception and login is complete.
ALS also offers numerous other beneficial reports that provide information on the entire testing process, which helps to confirm data quality goals have been met. One powerful example is the ALS Quality Control Interpretive report, which delivers a full assessment of laboratory QC, in addition to details on holding time compliance and QC frequency.
ALS Quality Control Interpretive Report
The ALS Quality Control Interpretive (QCI) report automatically generates an at-a-glance summary evaluation and interpretation of QC results and other critical quality elements associated with the testing process. This report highlights exceptions and outliers to ALS Data Quality Objectives, holding time compliance, QC sample frequencies, and lists important methodology references and summaries.
Data Quality Objective Compliance
It is ALS policy that all QC results should fall within control limits. If exceedances occur, appropriate action is taken within the lab, including reanalysis of client samples associated with outlying QC results. Sometimes this cannot be done due to insufficient remaining sample, in which case the associated test results are qualified with comments to provide context and information for how DQO exceedances may impact sample results. The Summary of Outliers section of the QCI report (Figure 1) indicates whether any DQO exceedances have occurred; if outliers exist, details are provided.
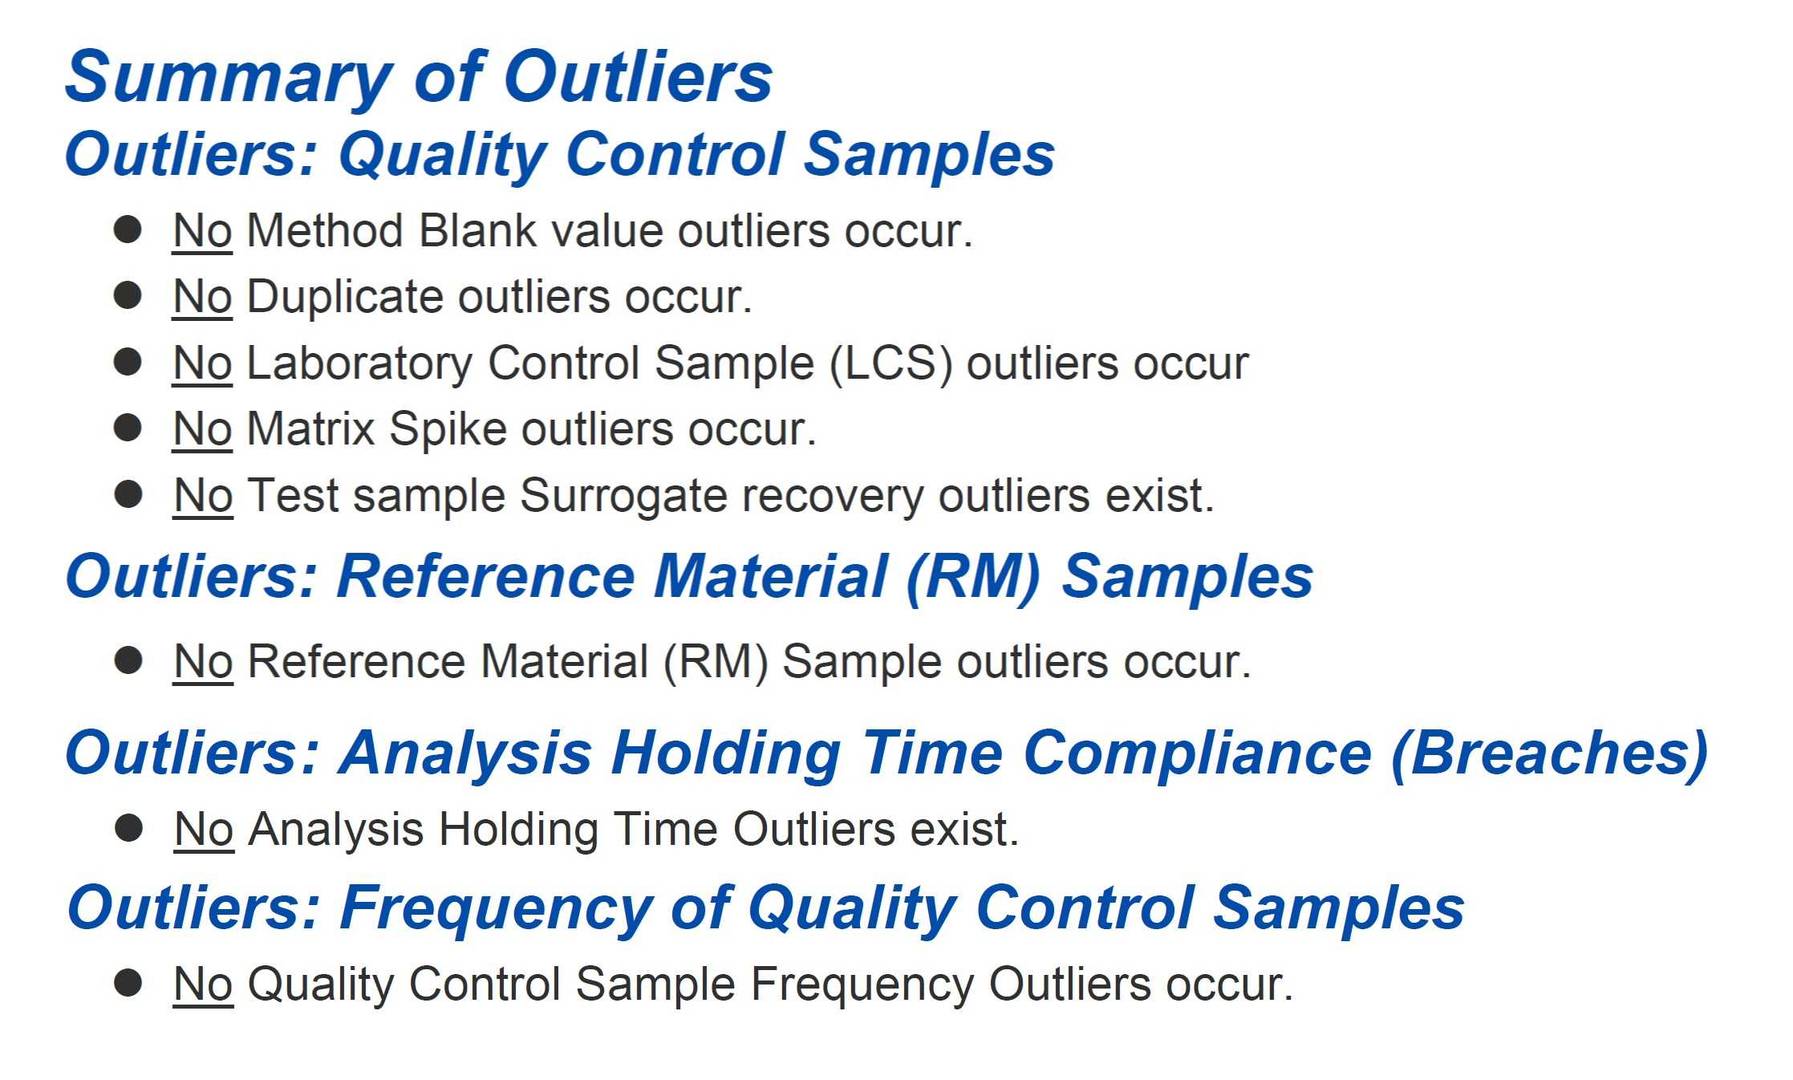
Figure 1: Summary of Outliers
Analysis Holding Time Compliance
The Holding Time compliance section of the QCI report summarizes details around commencement of analysis.It includes relevant dates of sampling and laboratory preparation and/or analysis. The hold time is calculated and an evaluation is presented. Where preparation and analysis were performed within holding times, this will be displayed as shown in the below example (Figure 2). If there are hold time exceedances, these will be indicated and additional comments will be provided.

Figure 2: Analysis Holding Time compliance evaluation from QCI Report
QC Sample Frequency Compliance
QC samples are analyzed in analytical batches (QC lots) of client samples. The expected frequency of QC analysis is defined by each test method for each QC type. This section of the QCI report (Figure 3) indicates whether the expected frequency of each QC type was met. Where the actual frequency of QC is greater than or equal to the expected frequency, the evaluation will display a pass. If the frequency is lower, the evaluation will show it to be outside of the specification and additional comments will be provided to explain how this affects client sample results.

Figure 3: QC Frequency compliance evaluation from QCI Report
Methodology References and Summaries
Analytical methods used by ALS are developed using nationally or internationally recognized reference methods, where available. The methodology section of the QCI report (Figure 4) outlines which analytical methods were used for analysis, including a general description of the test. Modifications to improve performance of the test are indicated with a note that the reference method has been modified where permitted, e.g., APHA 5220 D (mod). Modifications are fully validated and are intended to provide superior data quality.

Figure 4: Methodology Summary from QCI Report
Other QC Report Options
ALS offers a wide array of reports designed to meet your project needs. The QCI report is just one such option, and is intended to make review of Holding Time and QC DQO compliance easy. Additional QC report types are also available, including a comprehensive QC Report and Excel Report. Both of these reports include all QC results associated with sample testing, where more complete information is needed.
Please contact your ALS Project Manager to request PHC tests with optional silica gel cleanups or qualitative chromatogram evaluations in cases where you suspect interferences on PHC tests due to biogenic substances.